

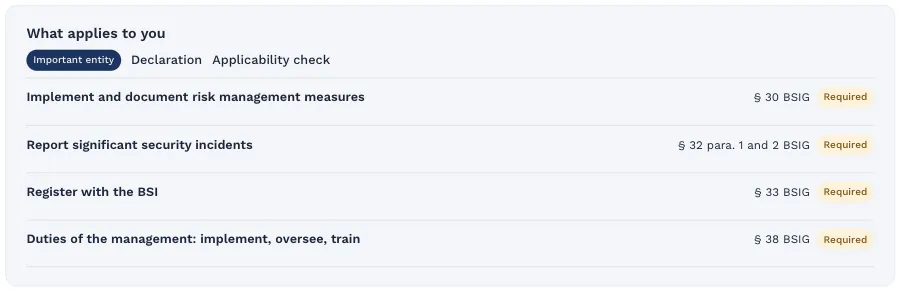
This guide shows how to recognize a good key figure, when a test tells you more than a number, and what a report looks like that lets management decide. The examples are invented.
What the law requires
- § 30(1) BSIG (German BSI Act): Measures must be appropriate, proportionate and effective, and the entity must document compliance.
- § 30(2), no. 6 BSIG: The minimum measures include policies and procedures to assess the effectiveness of risk management measures. The European basis is Art. 21(2)(f) NIS2 Directive.
- § 38(1) BSIG: Management implements the measures and oversees their implementation. It can only oversee what someone measures and reports to it.
Implementing Regulation (EU) 2024/2690 goes into more detail in point 7 of its Annex. It applies directly only to certain digital services, such as cloud providers and managed service providers (§ 30(3) BSIG). Its structure still works as a template for any company. It asks which measures are to be monitored and measured, by which method, when, by whom, when the results are analyzed and who evaluates them. The policy takes the risk assessment and previous significant incidents into account and is reviewed at planned intervals, and also after significant incidents and major changes.
In June 2025 ENISA published non-binding guidance on this, the Technical Implementation Guidance. If you know ISO/IEC 27001, you will find the same idea in clause 9.1 (monitoring, measurement, analysis and evaluation). ISO/IEC 27004 is the related guidance on measurement.
Three ways to prove effectiveness
Key figures alone are rarely enough. Combine three kinds of evidence:
- Key figures: Ongoing values from your data, such as the share of critical suppliers with an assessment. They show trends and early deviations.
- Tests: A measure is tried out in practice: restore test, emergency exercise, phishing exercise, penetration test. A test shows whether something works when it matters, not only whether it exists on paper.
- Internal checks: An internal audit or a sample checks whether processes are lived the way they are written. This finds what key figures cannot see, for example a remote access that was never in the register.
Rule of thumb: for every important measure at least one key figure or one test per year, for the most critical ones both.
Good key figure or vanity metric?
A vanity metric looks good and changes nothing. "12,000 attacks blocked per month" describes the work of the firewall, not the security of the company. "100% of staff trained" says nothing about whether anyone reports a phishing email.
A good key figure meets five conditions:
- It belongs to a measure and a risk. You know which question it answers.
- It has a target and a warning threshold. Only then is there "on target" and "off target".
- It has an owner. Someone measures it and explains deviations.
- It is reproducible. The source is fixed, not an estimate made in the meeting.
- It leads to a decision. Test question: what would we do differently if the value were worse? If the answer is "nothing", drop the key figure.
Watch the population, too. A patch rate of 98% can look good and still leave out exactly the operator stations on the shop floor. Measure where the risk is, not averaged over everything.
The measurement policy in six steps
- Select measures. Start with the ten topics in § 30(2) BSIG and set priorities based on your risk assessment.
- Set the method. Key figure, test or internal check, with source and calculation.
- Set target and warning threshold. Give a short reason for both. A target of 100% only makes sense if you can hold it.
- Settle rhythm and ownership. Who measures when, who analyzes, who evaluates?
- Report. Summarize the results for management, with the trend and the decisions needed.
- Review the policy. At least once a year and after every significant incident: are we still measuring the right things?
Example: key figures of an industrial company
The example is invented. A machine builder with 600 employees and two plants is an important entity. It has put its key figures on one page. The targets are examples from this company, not legal requirements.
| Topic (§ 30(2) BSIG) | Key figure or test | Target | Source | Rhythm |
|---|---|---|---|---|
| No. 1 Risk analysis | Risks above the acceptance level without a decision | 0 | Risk register | Monthly |
| No. 2 Incidents | Time from detection to first assessment, median | At most 4 hours | Incident register | Quarterly |
| No. 3 Continuity | Restore test of the MES database within the planned recovery time | Passed | Test record | Every six months |
| No. 4 Supply chain | Critical suppliers with a valid assessment | At least 95% | Supplier register | Monthly |
| No. 5 Vulnerabilities | Critical OT vulnerabilities without a patch or compensating measure after the deadline | 0 | Vulnerability list | Monthly |
| No. 6 Effectiveness | Important measures with a key figure or test in the last 12 months | 100% | Measurement policy | Yearly |
| No. 7 Training | Reporting rate in the phishing exercise | Rising, at least 60% | Exercise evaluation | Every six months |
| No. 9 Access | OT remote accesses with approval and expiry date | 100% | Remote access register | Monthly |
| No. 10 MFA | Administrator and remote access accounts with MFA | 100% | Directory service | Monthly |
Two rows show the difference from a vanity metric. For training, the reporting rate counts, not attendance. For vulnerabilities, treatment by a patch or a compensating measure counts, because many controllers cannot be patched right away.
What the first quarter showed: The restore test of the MES database took much longer than planned, because a key for the backup was kept only on one laptop. The finding became a corrective action with a due date, and the repeat test in the next half year passed. That is exactly what measuring effectiveness means: a weakness shows up in a test, not in a real emergency.
The report to management
Management does not need raw data, it needs a basis for decisions. A quarterly report with these parts has proven useful:
- Traffic light per topic with text, not only color: "on target", "warning threshold reached", "off target".
- Trend instead of a snapshot: The course over several quarters shows whether measures take hold.
- An explanation of every deviation: cause, action, owner, due date.
- Results of tests and checks: passed, failed, what follows.
- Decisions needed: budget, staff, risk acceptance.
Record that management received the report and what it decided. This is evidence of oversight under § 38(1) BSIG. The guide on § 38 BSIG explains the other duties of management.
Checklist
- Every important measure has a key figure, a test or an internal check.
- Every key figure has a source, a calculation, a target and a warning threshold.
- Every key figure has an owner.
- Key figures that never lead to a decision have been dropped.
- Tests for restore, emergencies and phishing are planned and evaluated.
- Internal checks cover the most critical measures.
- Management regularly receives a report with the trend and the decisions needed.
- Deviations lead to corrective actions with a due date and a repeat check.
- The measurement policy is reviewed every year and after significant incidents.
Measuring effectiveness with Complass
In a spreadsheet every key figure is collected by hand, and the report is written the evening before the meeting. In Complass the values come from the data you work with anyway:
- Key figures over time: Every night Complass records important key figures, such as overdue risk treatments, open critical and high vulnerabilities or assessed critical and high suppliers, and shows the trend over 30 days, 90 days or 12 months.
- Objectives with traffic lights: You set measurable objectives with a target, a warning threshold, an owner and a due date, measured against a key figure from Complass or against values you enter yourself. The traffic light shows a symbol and text.
- Control tests: Every day Complass checks automatically whether your data still supports a measure, for example MFA for administrators or the last evaluated emergency exercise. Every test counts as evidence.
- Management report: A PDF or PowerPoint file with implementation status, risks, incidents, vulnerabilities and the trend of the key figures. You add your own assessment and decisions.
- Findings: You record missed key figures, exercise results and audit findings in the findings register, with a corrective action and an effectiveness check.
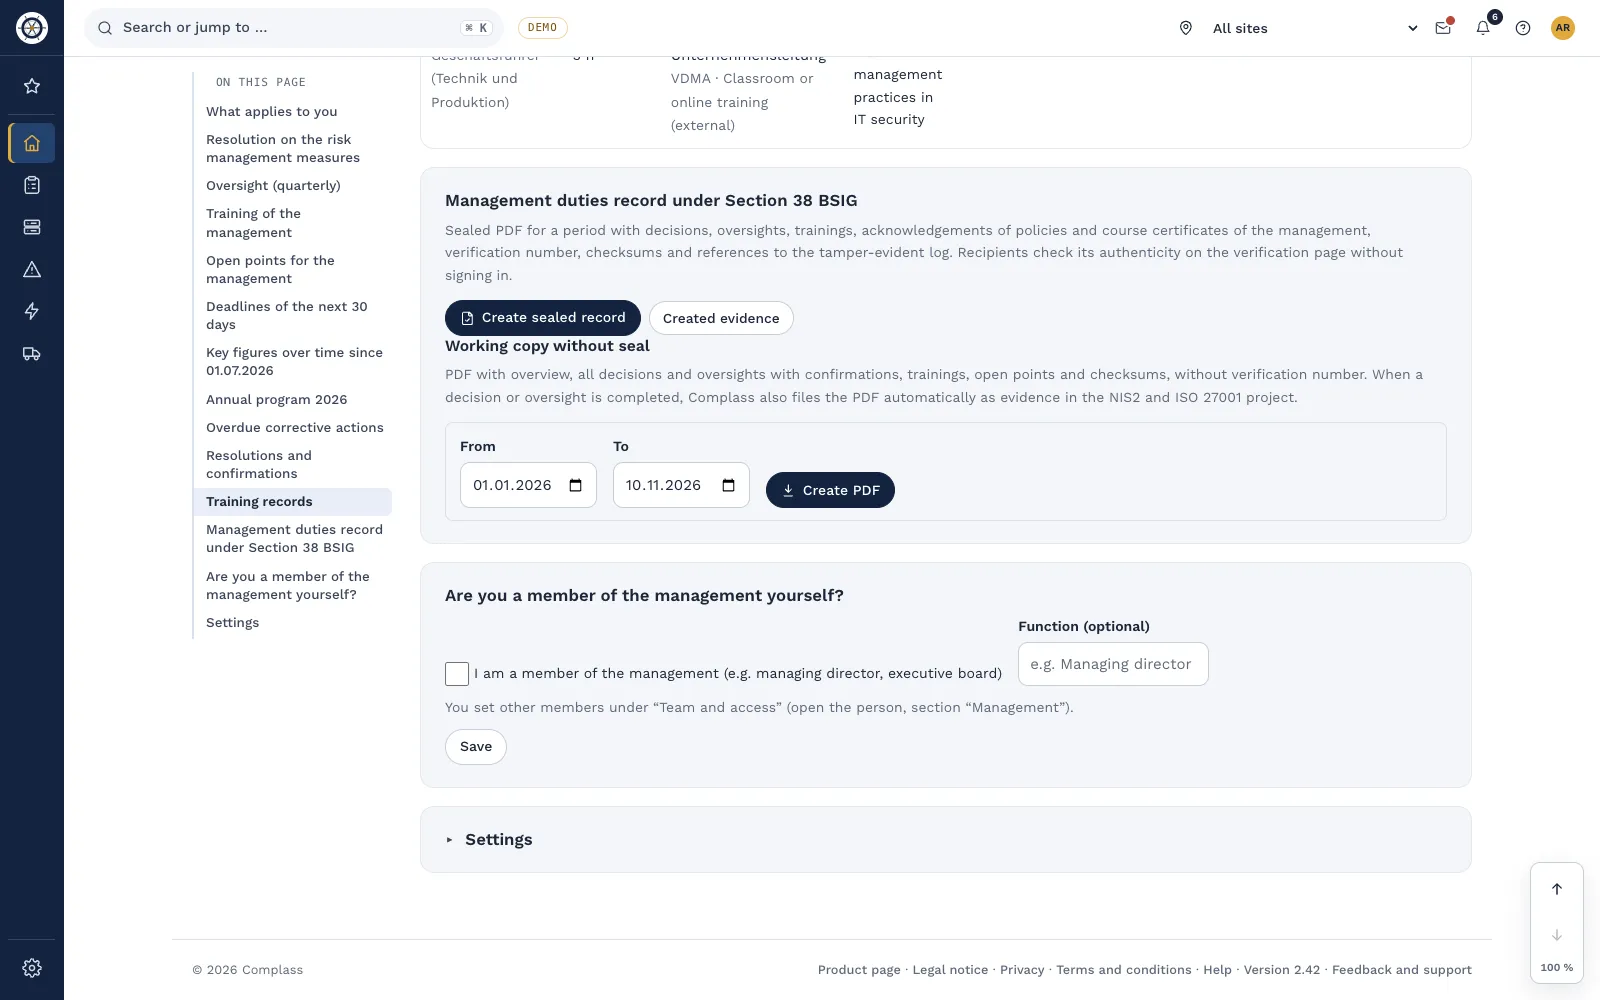
- Evidence under § 38 BSIG: A sealed PDF sums up the decisions, oversight and training of management for a period.
Frequently asked questions
Does the law prescribe particular key figures?
No. § 30(2), no. 6 BSIG requires policies and procedures to assess effectiveness, but no particular key figures or targets. You choose them to fit your risks and give your reasons.
How many key figures make sense?
As few as possible, as many as needed. For the report to management, ten to fifteen are often enough. Departments can keep further values for themselves.
Does an ISO 27001 certificate replace the effectiveness assessment?
Not automatically. Certification also checks whether your ISMS measures and evaluates under clause 9.1. Whether its scope covers all services and plants that fall under NIS2 is a separate question.
How often should we measure?
That depends on the measure. Ongoing key figures suit monthly evaluation, restore tests and emergency exercises rather every six or twelve months. Set the rhythm in the measurement policy and keep to it.
What if a key figure is red?
Explain it, do not hide it. Record the cause, corrective action, due date and owner, and check afterwards whether the action worked. An openly documented red value with a plan convinces more than a page full of green fields.
In a demo we use the demo company to show you how key figures, objectives and control tests flow into a report for management.
Request a demo Try it for 14 days
Read more
- Guide "Management and NIS2: what § 38 BSIG requires"
- Guide "Implementing NIS2: the step-by-step guide"
- Guide "ISO 27001 management review with a template"
- Whitepaper for management
- NIS2 in Complass
- Compliance management: objectives, key figures and control tests
Not legal advice. This guide gives a general overview and does not replace an assessment of the individual case. The current wording of the BSIG and of Implementing Regulation (EU) 2024/2690 and your licensed editions of the standards are authoritative. As of November 2026.